Dividend Growth Investor Newsletter

Pages

Thursday, February 28, 2008

Warren Buffett - The richest investor in the World


Warren Buffet is one of the best investors of our time. He has been investing other people’s money through partnerships and Berkshire Hathaway since the late 1950’s. His results have been truly phenomenal. I highly recommend reading his annual letters to Berkshire’s shareholders.

I recently stumbled upon the letters to his investors in the Buffet Partnership here . His average annual returns of 29.5% for the period from 1957 to 1969 significantly outperformed the 7.4% return that Dow achieved.

He recently made news headlines with his investments in Kraft Foods and Glaxo-Smith Kline. I was wondering myself if following the Wizard of Omaha is a good investment strategy or a recipe for disaster. I found the following research paper “Imitation is the Sincerest Form of Flattery: Warren Buffett and Berkshire Hathaway” on the internet. It was written by Gerald S Martin and John Puthenpurackal and studied Buffet’s stock picking for a 31 year period from 1976 to 2006. Based off their research, a portfolio that mimicked Buffet’s stock investments would have outperformed S&P 500 by 14.6% annually. The stock market average returned 10.32% versus 24.97% for Buffet’s portfolio of stocks. In addition to that the research paper found that investors would have performed much better had they simply invested in Berkshire Hathaway’s stock would have returned 30% on average.

Even though Buffet is 77 years old and even if he decides to no longer be the CEO of Berkshire Hathaway, I still think that the company is a good Long-Term holding. The reason is because Buffet invests in businesses that he thinks have good prospects for the long term. So even if he’s no longer in charge at BRK.A, the worst annual average that his stockholders will have would be at par with the S&P 500.

Tuesday, February 26, 2008

The next bubble in the making.

Over the past 10 years the US economy has experienced the bursting of two major bubbles – the dot com bubble and the real-estate bubble. The Federal Reserve has been blamed for both failures – the first one happened supposedly because the US central bank hesitated to increase its interest rates too much until tech stocks started jumping like kangaroos in the Australian deserts in late 1999. The second bubble was formed just as the dot com bubble imploded and the FED tried stimulating the economy with lowering interest rates to multi-decade lows. Rates on fixed income instruments had fallen to multi-decade lows, and stocks were in a major bear market. Investors had nowhere to go for income. This situation stimulated speculation in the housing market and helped the US economy regain its power and achieve six years of prosperity.

Currently the US and Foreign stock and property markets are weak, ever since the subprime problems started making huge headlines in July 2007. Interest rates are declining again, which leads very few options for investors to invest and grow their savings right now. Somewhere down the road real-estate would pick up again, but it is still too early for that to happen in my opinion. One of the reasons for today’s real-estate bubble is that properties were sold to people who cannot afford them at all. If you are making $20,000 per year and you purchased a property for $500,000, which you were able to afford only with an ARM, with the intent of flipping it out for a huge profit, even if you refinanced your loan to a 0% interest per year, you would still be unable to keep up with the monthly payments. Most of those investors are holding such properties which they cannot afford, but which would lead to huge losses if they sold them right now. Those investors are trying to rent their properties in order to decrease their losses. This creates a very competitive market for landlords right now. Pundits are claiming that now is the time to buy into real estate. I believe that the next one or two years will also be considered “the time” to buy real estate. When no one believes in the real estate market, that’s when it will bottom out and start going up.

One of the few alternatives for investments is stocks that pay a relatively stable dividend, and which have maintained or increased their dividends over the years. There are several dividend based ETF’s out there some of which launched recently. This shows to me that the investment community is anticipating a demand for stable income producing securities in this unstable time. There are several major stock lists out there which contain dividend achievers, dividend aristocrats and high-yielding aristocrats and achievers. With very few reliable sources of dependable income from stocks, investors have few other choices but to invest in the dividend stocks of our times. I think that the dividend aristocrats would be the next bubble that will be formed from the current low interest rates. Investors, burned from the rest of the market, would flock into one-decision large cap stocks with good liquidity, which could be bought and held forever regardless of price. Something similar happened in the late 1960’s until the 1974 bear market with the so-called “Nifty Fifty” stocks.

I am already seeing big increase in interest in dividend paying stocks especially the above mentioned lists. If a bubble in dividend aristocrats/achievers does occur, that would enable me to reach my goals of $200,000 in net worth earlier than expected. If it doesn’t happen, then I would probably expect normal average rates of return of around 10%-11% annually. Very Boring.

Monday, February 25, 2008

Cola Wars - Coke versus Pepsi

PepsiCo, Inc. manufactures, markets, and sells snacks and beverages worldwide.
The Coca-Cola Company engages in the manufacture, distribution, and marketing of nonalcoholic beverage concentrates and syrups worldwide.


Both stocks are dividend aristocrats as well as major components of the S&P 500 index. Over the past 10 years Pepsi (PEP) has significantly outperformed Coca-Cola (KO) by delivering an average total return of 10.46% annually to its loyal shareholders versus 2.28% for KO. Pepsi (PEP) has also managed to deliver an impressive 11.93% average annual increase in its EPS which was slightly better than the 11.25% increase achieved by Coca-Cola (KO).


Pepsi’s ROE has been in a 28%-37% range for our study period, which is also an impressive number. Coca-Cola’s ROE has declined dramatically during our study period, falling from a high of 42% in 1998 to its 2001 low of 23%, before recovering slightly to hover around in the 25%-34% range.


Annual dividend payments for Pepsi and Coke have increased over the past 10 years by an average of 11.71% and 9.30% respectively. These dividend growth amounts are in line with the EPS growth for Pepsi, but lower than the EPS growth for Coca-Cola.
It is quite noticeable that over the past 5 years both companies have increased their dividend growth rates significantly. Pepsi has increased its average annual dividend growth rate to 19.46%, while Coca-Cola has managed to increase its dividend payments by a mere 11.20%.


An 11% growth in dividends translates into the dividend payment doubling every 7 years. If we look at historical data, going as far back as 1977, both PEP and KO have indeed managed to double their dividend payments on average every seven years.

If we invested $100,000 in PEP on December 31, 1997 we would have bought 2759 shares. Your quarterly dividend income would have been $344.87 in early 1998. If you kept reinvesting the dividends though instead of spending them, your quarterly dividend payment would have risen to 1203 by December 2007 and you would be expecting to collect $1209 in late March 2008. For a period of 10 years, your quarterly dividend income has increased by 200 %. If you reinvested it though, your quarterly dividend income would have increased by 249%.


A similar investment in Coca-Cola would have provided you with a starting quarterly dividend payment of $224.85 in early 1998 which would have risen to $635.80 by November 2007, and would be expected to increase to $714.40. For a period of 10 years, your quarterly dividend income has increased by 126.67 %. If you reinvested it though, your quarterly dividend income would have increased by 182.7 %.


I also like the fact that Pepsi’s dividend payout has not exceeded 50% over the past 10 years in addition to the low P/E ratio, which is only slightly above 20, and a decent dividend yield of 2.1%.


On the other hand Coca-Cola is more expensive than Pepsi, with its higher P/E of 25. In addition its dividend payout has spent the majority of the past decade above 50%, rising to as high as 77% in 2000.


Overall Pepsi has shown a much bigger progress than Coke over the past 10 years. In addition, it’s trading at a bargain multiple relative to its biggest competitor. And last but not least, its dividend growth is much higher than Coke. I would consider adding to Pepsi on dips below $68. I might also consider adding to Coca-Cola below $51.

Disclosure: I do own shares in PEP. This analysis of the stocks is not an investment advice.

Thursday, February 21, 2008

Can money grow on trees?

I was researching alternative assets classes that not only could perform as well as the stock market but also provide good diversification opportunities as well as passive income possibility. One asset class which seems a little overlooked is timber.
According to several websites that I found, investing in timber has beaten the stock market by 4 percentage points from 1973-2003.

There are several advantages of investing in timber:

  • Timber is uncorrelated to stocks
  • The price of timber has consistently beaten inflation by 3.3% over the past decades
  • Unlike other commodities, trees grow every year by 4% - 10% and as they age their wood becomes more valuable
  • Even if prices decline, you can decide not to cut your trees in a given period. Your trees would be growing no matter what you decide to do with them.
  • You get certain tax breaks – your profit is taxed as a capital gain. On top of that, as timber is cut, another tax break called a depletion allowance kicks in.
  • You could invest in timber REIT’s, like PCL and RYN, which are publicly traded on NYSE
  • The Food and Agricultural Organization of the United Nations forecasts that world demand for wood will nearly double by the middle of this century.
  • The USDA-Forest Service projects that demand for U.S. forest products will reach 25 billion cubic feet annually by 2050, up from nearly 18 billion in the 1990s.

There are several disadvantages of investing in timber as well though

  • Most direct timber investment is limited to wealthy individuals who can chip in at least $1,000,000 to $5,000,000.
  • Timber Investment Management Organizations typically require a ten year lock up period to their investors
  • Timber Investment Management Organizations typically charge hedge fund like fees of 1% on all the assets invested plus 20% of the annual profits. It seems like you do need some managing of your forests in order to maintain them.
  • Trees could be subject to fires. 0.5% of all trees suffer from this
  • Trees could suffer from disease’s, so one should spread their timberland holdings across the globe
  • Timber investments have soared form 1 billion in 1989 to more than 20 billion by 2005. Seems like the market is getting crowded.
  • Even though timber investments have provided investors with 22% annual returns on average form 1987-1996, the returns have dropped to 8 % over the past decade
  • Demand for timber is subject to cyclical swings in the economy. If housing starts plummet or manufacturers need less cardboard, then prices could plummet.

    You could find more information about investing in timber under the following links below:

Investment University , Financial Planning , MSNBC, Tropical Hardwoods( I am not sure if this last link is the real deal or not, so please use with caution)

My financial resources are still less than 1 to 5 million in order to invest directly in timber. For diversification purposes though, I am considering investing in RYN or PCL. Stay tuned for my analysis of these two companies.


Tuesday, February 19, 2008

Alternative Streams of Income

Alternative Streams of Income

I am always looking for ways to increase my income. I have a good paying job, which required me to work hard at school and spend several years of my life learning to juggle multiple activities successfully. I like my job but I think that I could always do better money wise. There’s always the possibility that I could be laid off because the company is not doing ok, or because I do a lousy job and thus my main source of income would be cut off. In order to avoid this, I think that I should have multiple income streams that would make me relatively independent in the extreme case that one of them dries up. I was brainstorming and I came up with several alternatives. They are not ranked by importance, and the ranking is not representative of their relative importance.

1 .Prosper/Lending Club lending and referrals

I have already started experimenting with peer to peer lending on Prosper and Lending Club. I am looking to lend money to people with the best credit ratings possible, who are homeowners, and have a low debt to income ratio and who have a full-time job. In addition to that I would only lend to people who have a credible reason for getting credit. I would not lend to someone who says that they want to re-invest in prosper or a triple A borrower who wants to consolidate credit cards by applying for a 20% loan. Since I am looking for the safest, highest rated borrowers possible, I think that my returns would be somewhere close to 8-10% annually. I am aiming to refer more people to Prosper or Lending Club; I would receive a $25 dollar sign-up bonus for every lender or borrower that I refer. In addition, once the lenders that I refer bid on loans, they would automatically receive a $25 dollar bonus as well. If you have never signed up for those and you are exploring the opportunity for higher returns on your money than a bank deposit, there is a link to the right for applying at Prosper as a lender. If you need a referral for lending club, e-mail me at sagitarius_d@yahoo.com

2. Credit Card Arbitrage

Another way of creating passive income is by applying for no interest, no balance transfer fees credit cards, getting a check against your available balance and then putting it in a CD or high-yield savings account. This was a nice way to generate some extra income when the interest rates were going up. As the interest rates are dropping across the board, this strategy is losing its appeal. The main drawbacks were that in order to make $1000 with a 5% CD or savings account, you had to have a credit card balance of about $20,000. Credit card companies do not offer high credit limits like that on newly minted credit card holders. But if you open several credit cards at once, you might be able to pull this through. Another negative from this strategy is that your credit score would be negatively affected because you have high credit card utilization ratio.

3. Interest on CD’s, savings,

Putting your money in a CD or a high-yield checking account is the safest way possible to generate passive income. The money that you deposited is FDIC insured up to $100,000 for taxable accounts and up to $200,000 for IRA’s. You could buy CD’s with varying maturities ranging form 7 days do 20 years. Your interest rate is fixed and you could choose to compound the payments back into the CD or simply spend it. The only drawback is that during a high-inflationary environment your long-term fixed income instruments would lose purchasing value very fast. You could also buy bonds, which are not FDIC insured and which carry a higher risk, but also a higher yield. Fixed income is taxed as ordinary income; if you are in the 35% tax bracket, even a 5% yield means that you effectively make only a 3.25% after tax return. Check out the Best CD Rates from BloggingBanls.


4. Stock dividends

This is (or will be) my bread and butter passive income source. I am projecting to earn about $900 - $1000 from dividends this year. My passive income from dividends should reach easily about $ 8000 annually by 2014. I could argue that stocks that have a history of paying regular dividends offer the best real return on investment possibilities out there. I am focusing this blog mainly on stocks that tend to increase their dividend payments every year which is a good inflation hedge for ones dividend income. Even if the company doesn’t increase the dividend every year, but never cuts it and can achieve average dividend growth over time I would still consider it a good source of passive income. Basically once you buy a dividend aristocrat, you get paid four times a year. In addition to that you are rewarded for your smart investment with a raise year after year. Your income has a preferential tax treatment. You can reinvest your profits back into company stock, thus taking advantage of the power of compounding and the power of dollar cost averaging. You could do even better by spreading your risk across different sectors or even buying one of the many dividend etf’s out there. Stocks typically outperform most other instruments over the long run. They provide good long-term returns and are the best hedge against inflation. Dividend aristocrats have outperformed most stocks over the past 18 years. So basically you are getting the best of both worlds. Even if stock prices stay low for years, dividend investors still get paid in the form of dividends. They can choose to buy more stock at depressed levels or spend the money. I believe dividend stocks to be the perfect source of truly passive income. Once you set up your portfolio of 20-30 dividend achievers and make sure that dividends are automatically reinvested, you can go live in a desert island for 20-30-40 years. Come back and you will be positively surprised by the amount of money you have.

5 .Employer stock participation plan and 401K matching contributions.

Most people are not aware of it, but many companies offer their employee’s employer stock purchase plans. Workers have a certain percentage of their paycheck deducted and invested into company stock. The best part is that company stock is purchased at a discount, which typically ranges around 10-15% of current market prices without paying any commissions. Some plans have minimum holding periods although most don’t have any. If it doesn’t one could simply invest the maximum portion of their paycheck into company stock, and then sell it on the open market, thus realizing a risk-free gain.
Another way to get free money or a passive income stream is if your employer provides matching 401k contributions. Typically employers match 100% of the first 3%-6% of employee’s contribution into their retirement accounts. If you make $50,000 per year and you contribute 5% of your pre-tax pay that is matched at 100% from your employer, you are not only getting $2,500 in free money from your employer, but you are also saving a ton of taxes.

6. Signing up for bank bonuses through opening checking/savings accounts

I have signed up for several bank accounts over the past year, making some easy dollars. This strategy would not make you a ton of money, but it is also relatively risk free. One could make anything from 25 to 200 dollars for opening a checking/savings account. You should always read the fine print though, because you don’t want your bonus being eaten from commissions, charges and other things like that. Unless the new account offers you something much better than the checking/savings account that you have been previously used for years, I would close it after six months to a year.

7. Income from blogging.

My e-mail is constantly bombarded with advertisements guaranteeing $100 dollar per day income from ad sense systems. I am not going to lie – I think that blogging is a nice way to make a couple of bucks per day and there are people who can do it full-time and make thousands per month. But your income form blogging should be diversified as well into different advertising venues like ad sense, bidvertiser and many other programs out there. Since the inception of this site, I have averaged 80 visitors per day, making around $1 daily from advertising.
8. Filling online surveys

This is yet another way of making money online. You look for surveys which you qualify for, and earn money. Just like any other form of making money online, you earn most money through referring others. If you are interested in filing online surveys, you can register for inboxdollars.

9.Rental Properties

Another form of passive income could be obtained from renting out properties to tenants. Lots of people rent because they are unsure about their lives in the short-term, can’t afford to buy a house or for any other reason. Some landlords hire a manager to manage the day to day operations of the properties. But if your property company is on a scale that cannot support hiring a property manager, then you most probably have another full time job on your hands. One can make money from rental properties but there are a lot of things that will need to be fixed or replaced. It all depends on what your tenants are and what type of people they are. If the cash inflow from your rental property (rent payments, tax breaks, depreciation tax breaks) meets or exceeds the cash outflows to the rental property (mortgage payments, fixing stuff, property taxes, manager salary) you will have achieved alternative source of income. Another nice part about owning real estate is that you can put no money down, and borrow the entire amount to buy your rental properties from the bank, assuming that you can afford it even if you don’t find tenants at all.

10. Investing in Timber

I have recently stumbled upon several websites which discuss investing in timber as an alternative investment class. I have no idea how to invest in trees, and do not know how credible these sources are. However I do know that some major college endowment funds have been invested in “hard assets” such as timber. You might want to check it for yourself, but planting a tree, not doing any significant work and harvesting it in 20-25 years for a 12% annualized gain sounds like a nice long-term investment to me. I would try to make an analysis of investments in timber over the next couple of weeks. in order to determine the pros and cons of this strategy as well as find out the best way to implement it.

11.Have a part-time consulting job with flexible hours

One could always trade their free time after work for a part-time job with flexible hours. Since I am an accountant by education, I could easily file people’s taxes during busy season. I would interact with others, try to outsmart the taxman by looking for any deductions that my client is eligible for and most importantly see how much money my clients are making.

Those are the /alternative passive income streams for which I have thought of about implementing/ or implemented. They are in no way representative of all the possible income streams out there. If done improperly though, I am sure that they can become alternative sources of outflows. So always do your own risk assessment before dedicating your time to any business activity.

Relevant Articles:

- Dividend Aristocrats List for 2009
- Dividend Aristocrats
- Best Dividends Stocks for the Long Run
- Best High Yield Dividend Stocks for 2009
- Best CD Rates

Monday, February 18, 2008

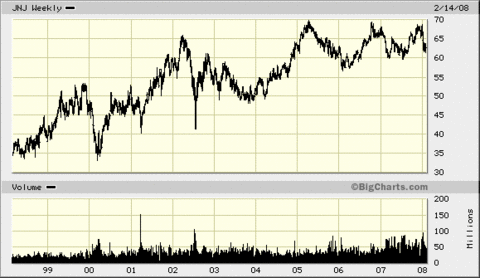
Johnson & Johnson (JNJ) Dividend Stock Analysis

Johnson & Johnson (NYSE:JNJ) engages in the manufacture and sale of various products in the healthcare field worldwide.

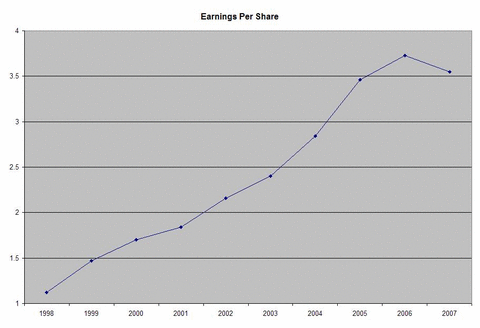
The company is a dividend aristocrat as well as a major component in Dow Jones Industrials and S&P 500 indexes. Over the past 10 years, the company has delivered an average total return of 9.76% annually to its loyal shareholders. One of the largest holders of JNJ stocks is none other than Warren Buffett, the Oracle of Omaha, who is one of the best investors in the world. The company has managed to deliver an impressive 14% average annual increase in its EPS.

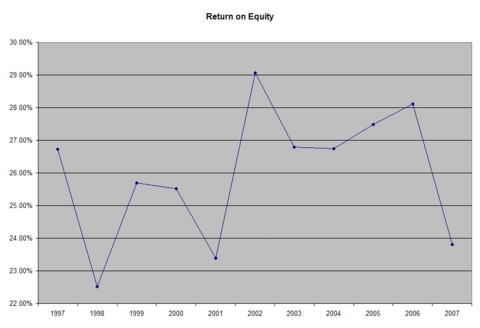
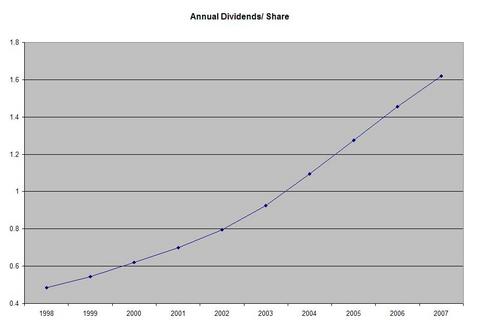
[click all charts to enlarge]

The ROE has been in a 22%-29% range for our study period, which is also an impressive number.

Annual dividend payments have increased over the past 10 years by an average of 15% annually, which is slightly above the growth in EPS. A 15% growth in dividends translates into the dividend payment doubling every 5 years. If we look at historical data, going as far back as 1970, JNJ has indeed managed to double its dividend payments every five years.

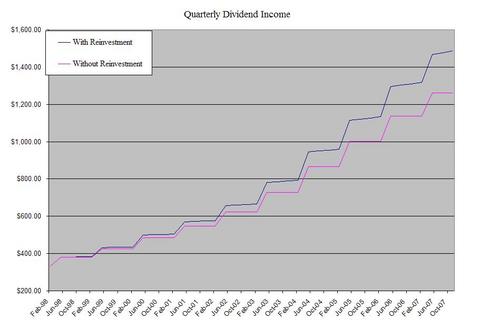
If we invested $100,000 in JNJ on December 31, 1997 we would have bought 3036 shares (adjusted for a 2:1 split in June 2001). Your first quarterly check would have been $333.96 in early 1998. If you kept reinvesting the dividends though instead of spending them, your quarterly payment would have risen to 1486.53 by November 2007 and you would be expecting to collect $1495.66 in late February 2008. For a period of 10 years, your quarterly dividend has increased by 277.27 %. If you reinvested your dividends though, your quarterly dividend would have increased by 345.12%.

I also like the fact that the company’s dividend payout has not exceeded 50% over the past 10 years, in addition to the low P/E ratio which is less than 20 and the above average dividend yield of 2.60%.


Friday, February 15, 2008

Dollar Cost Averaging

The media is constantly bombarding us with news about the US housing bubble, rogue traders, recession, bear market and many other ominous headlines. Unless you are a day trader who watches the market tick by tick I would advise you to ignore the noise. Most advisers tell you instead to focus on the big picture and follow your long-term goals of adding a fixed amount of money into stocks, which are automatically deducted from your paycheck. By spreading your purchases over time, you are a buyer when the market is overvalued, but you are also a buyer when the market is severely undervalued. In the end it would all even out for you. Those advisers recommend to their clients that they do not purchase everything at once but follow a disciplined approach to investing by putting a certain amount of money over predetermined fixed periods of time like every 2 weeks or every month. I was really intrigued about this strategy, because supposedly it decreases your risk and makes you buy stocks when prices are really depressed.

I used VFINX (Vanguard S&P 500 index fund) total return data to test the performance of a lump sum investment versus dollar cost averaging. I assumed that an investor has $1200 to invest at the end of each January. They have two choices – invest it all at once at the end of January or spread their purchases over time. If they chose the second option, they would put $100 at the end of each month starting at the end of January. I ran the scenarios on monthly data from 1988-2007. The results really surprised me. Investors who purchased it all at once at the end of January achieved an average annual return of 11.28%. Investors who chose to dollar cost average achieved only a 6.22% annual return. That’s a 5% difference per year, every year. In addition, dollar cost averaging outperformed lump sum investing during only 3 years over the 20 year period – in 1994, 2001 and 2002. At the end of each year lump sum investors were $60.75 richer than dollar cost averagers. While it could be argued that the idle funds would have been earning interest I found that even if the cash was earning 6% annually over the past 20 years, lump sum investors would still be ahead by $26 per year on average.

If we actually started this experiment at the end of each December over our test period (1988-2007) instead of January, and checked at the end of the next December how much we have made the lump sum still outperforms dollar cost averaging by 5.50% annually. Of course if all you ever invested were the $1200, your total return over time would have been almost the same for the lump sum portfolio and the dollar cost averaged portfolio. If you put all $1200 in VFINX at the end of 1987 and reinvested your dividends, your stake would have been worth $ 10,840.91 by the end of 2007. If you decided to do dollar cost averaging with the $1200 by investing $100 per month starting in December 1987 and then you didn’t make any additional purchases but simply reinvested your dividends, the value of your portfolio would have been $ 10,021.24.

While it would be difficult for most investors to invest it all at once, since most of their investment contributions come through regular payroll deductions, it seems that although dollar cost averaging does prove beneficial during flat and down markets, it is inferior to a simple buy and hold approach. Academicians have shown that investors are pretty bad at timing the markets. Dollar cost averaging could be one of those timing strategies which contribute to the underperformance of a large number of the participants observed in those studies. Despite the fact that most investors have to dollar cost average, investing in the stock market even through an inferior entry strategy could produce far better returns over time than holding no stocks at all.

The spreadsheet can be accessed here: http://spreadsheets.google.com/pub?key=pOzbJBiI71k138vCpgQ50dw

Relevant Articles:

- Dividend Aristocrats List for 2009
- Dividend Aristocrats
- Best Dividends Stocks for the Long Run
- Best High Yield Dividend Stocks for 2009
- Best CD Rates

Thursday, February 14, 2008

The pros and cons of selling covered calls on dividend paying stocks.

Selling Covered Calls is a strategy in which an investor sells a call option contract while at the same time owning an equivalent number of shares in the underlying stock. It is considered to be one of the safest option strategies in the market. Typically it is performed over a short term period of time, since option contracts always have a finite lifespan. The typical strike price at which call options are sold is normally above the current price at which the stock is trading. Thus, if Pepsi stock is trading at 70, its shareholders could sell a covered call at $75 strike.

The economic incentive for the seller for writing a covered call is that he collects options premium, which increases his income from the stock he owns. With the passage of time, the time value portion of the option's premium generally decreases - a positive effect for an investor with a short option position. In addition to that, the stockholder still owns the stock after he writes a call. So they continue to collect all dividends paid as long as the option is not exercised!

This strategy is most profitable when stocks trade in a range and as a result the call option expires worthless. Thus an investor who can correctly predict that a stock would not experience significant price swings over a certain period in the future, could achieve extraordinary results over time. Investors are also always free to purchase the covered call back from the market at any time if they change their opinion on the direction of the stock price. Even if stock prices decline after a covered call has been written, the investor is still better off, because their losses are smaller due to the options premium collected. If the option expires worthless or is sold profitably and the investor still owns the underlying, they can generate more income by selling more covered calls.

Selling Covered Calls sounds appealing at first, because theoretically one could get two passive income streams from one stock. There are some risks with this strategy though, which might make it less appealing to investors.

First, if the stock price rises above the strike price at which the call was written, one would not be able to participate in any upside gains in the stock, because they are required to sell it to the call buyer to whom the call option was written in the first place. The only scenario in which the investor will keep the stock and the premium is when the stock price does not increase above their strike price. This strategy seems inferior because it assumes that investors could time the market by betting whether or not the stock would be above/below the strike price at expiration. Studies have shown that investors are pretty bad at timing the markets, because the majority always seems to be selling at the bottom and buying at the top. The strategy also seems inferior because by writing covered calls stockholders are limiting their upside potential, while leaving their downside wide open. You are selling your rising stocks and keeping your losers, while earning some income in the process, which in reality is eroding your capital gains. The psychological weak points of this strategy is that most investors always believe that their stocks would be rising over time, so betting against your own portfolio in terms of covered call selling seems counterintuitive. It also does not eliminate the risk of stock ownership - if a stock declines, investors will still suffer losses, although they would be a little lower due to the premium received.

Another negative for owners of dividend stocks who sell covered calls on their holdings, is that there is always the possibility that the call holder might want to capture the stock’s dividend. In that case, the option must be exercised a day before the underlying stock’s ex-dividend date. That’s the only way for the call holder to purchase underlying shares and be eligible for the dividend. In this case, you might not receive notification that the option has been exercised until the ex-dividend date itself.

In conclusion selling covered calls on dividend stocks could theoretically provide an investor with two potential streams of income from one stock if its price does not increase above their strike price – options premium collected and dividends payments received. If the price increases, the call option will be exercised and the investor must sell his stock at a predetermined price. They won’t be able to participate in the stocks upside, unless they buy their stock back, at higher levels. Furthermore the strategy does not protect against declines in prices of the underlying. Just like any strategy involving securities there is always the opportunity for a huge profit if done correctly, or for a huge loss if done incorrectly. Thus an investor will always be better off in the long run if they took those strategies with a grain of salt and do their own due diligence before taking any action, which could impact their finances.

Wednesday, February 13, 2008

Long term returns of S&P high-yield aristocrats versus the S&P 500

In my previous article I discussed the performance of the S&P Dividend Aristocrats.
We found that the list outperformed the S&P 500 index through good and bad years with a significantly lower volatility. The reality is that there is another list with dividend aristocrats generated by the S&P – it’s the High Yield Aristocrats list, which picks the 50 highest yielding stocks in the S&P 1500 index that have increased dividends for at least 25 consecutive years.

The index is weighted by yield, unlike the equally weighted Aristocrats, which accentuates the equity-income characteristics of the index. It was launched recently, and has been “back tested” to a base value of 1000 on December 7, 1999. The High-Yielder’s offer an average 3.91% dividend yield which is more than a percent better than the Regular Dividend Aristocrats average of 2.93%. The index has significantly outperformed the S&P 500 index and even the regular dividend aristocrats since its launch in late 1999. It achieved average annual total returns of 11.61%, versus 8.85% for the regular aristocrats and a meager 2.77% for the S&P 500. I would not expect the list to outperform the major us stock index benchmark every year, since “fashions” on wall-street seem to be changing every couple of years or so. Over the past 8 years, the index has underperformed S&P 500 only 3 times - in 2003, 2005 and 2007. However if you have an investment horizon of at least 15-20 years I believe that you should be able to outperform the market.

If you are a fan of dividend ETF’s, then today is your lucky day. State Street has launched an ETF that’s covering the High Yield Dividend Aristocrats. It’s trading under the ticker SDY. As of 12/31/2007 financials had the highest sector weight in the index, followed by utilities. The ETF has an annual management fee of 0.35%, which is not that bad for a specialized ETF.


My only issues with this index are that it is not equally weighted and that it has been around for only two years or so. There is a tendency for equity research companies to back test past data in order to find an investment solution that could have worked perfectly through a procedure called data mining. It is a little bit suspicious that the index underperformed S&P 500 after it was launched. So if you are intrigued about buying stocks that have shown very good results in the past please remember the “past performance does not guarantee future results” disclaimer and always do your homework before you put your hard earned cash to work.

Tuesday, February 12, 2008

E-Trade Savings Account Bonus

E-Trade still has an offer for their Complete Savings Account, which offers up to 8 times the national average.

A $1 minimum deposit is required to open a new account. Withdrawal limits apply. Online statements required. $25 will be credited to your Complete Savings Account within 30 days of the account being funded with a minimum deposit of $1. Payments will be reported as interest income. Accounts must be opened by 3/31/2008 to quality for the $25 offer. Must be a new account opened with new funds. Offer applies to one new account per customer. Not good with any other offer. This offer is not valid for E*TRADE FINANCIAL employees.

I signed up for my E-Trade savings account back in December. I deposited just one dollar. 30 days later I had 26 dollars in my account and I was happy.

You could also get some more info on this site below:

http://www.bargaineering.com/articles/opened-an-etrade-complete-savings-banking-account.html

Monday, February 11, 2008

Cincinnati Financial – An insurance stock to own

Cincinnati Financial Corporation, through its subsidiaries, offers commercial, personal, and life insurance products to businesses and individuals in the United States.


CINF is on both the Dividend Aristocrats and High-Yield dividend aristocrats lists.

Over the past 10 years this dividend growth stock has delivered an average total return of 3.07% annually to its loyal shareholders. The company has also managed to deliver an impressive 18% average annual increase in its EPS.


The trend in ROE has followed the trend in earnings per share over our study period. This indicator was in a free fall from its 6.35% level in 1997 to its 2000 low 1.97%. After that it has been steadily rising to levels above 12%.


The company recently announced that it would raise its quarterly dividend by 3.5 cents to 39 cents per quarter, which represents a 9.9% increase from 2007. The company has increased its dividend for 48 consecutives years. CINF has averaged a 5 and 10 year dividend growth rates of 11.96% and 11.14% respectively. It’s currently yielding a respectable 4.10% annually. The stock price has been trading in a narrow range over the past 10 years, which has offered a good entry points for dividend reinvestment at bargain prices. An 11% growth in dividends translates into the dividend payment doubling every 7 years. If we look at historical data, going as far back as 1990, CINF has indeed managed to double its dividend payments every seven years.


If we invested $100,000 in CINF on December 31, 1997 we would have bought 2295 shares (adjusted for a 3:1 split). Your first quarterly check would have yieleded $319.19 in dividend income in early 1998. If you kept reinvesting the dividends though instead of spending them, your quarterly dividend income would have risen to $1016 by December 2007 and you would be expecting to collect $1126.32 dividend income in April 2008. For a period of 10 years, your quarterly dividend income has increased by 155 %. If you reinvested it though, your quarterly dividend income would have increased by 218%.


I also like the fact that the company’s dividend payout has not exceeded 50% over more than twice over the past 10 years in addition to the low P/E ratio which is less than 10 and the above average dividend yield of 4.10%. I think that this financial stock has been unjustfully being punished with the rest of the financial group simply because of its asset class.


Overall I think that CINF is a long-term buy for the dedicated dividend investor. I would be a buyer of the stock as long as P/E ratio is below 20, its yielding above 2% and the dividend payout is below 50%.

Friday, February 8, 2008

The number one reason why i don't chase high-yielding stocks

During my early days as a dividend investor, I was focusing my attention to stocks which paid me a generous yield. I would be doing calculations, showing me that at a 10% annual yield I would be able to further compound my profits by reinvesting the dividends. One of the first stocks that I noticed was the Managed High Yield Plus Fund (HYF), a closed-end high-yield bond fund which was paying a generous 10-11% annual dividend. I bought some stock immediately, and after several weeks I received my first dividend payment, which was equal to almost a one percent return per month. I was very excited by this opportunity, which allowed me to compound my gains monthly through the regular reinvestment of dividends. The fund didn’t appreciate by much; nor did it depreciate by much. It was trading in a range, which was perfect for me - I kept receiving and reinvesting my fixed monthly payments of 5.5 cents per share.

After a while the price started decreasing, and I happily reinvested my dividends, realizing that now I would receive a higher yield for my investment at the lower prices. Instead of yielding 10%, the stock was now yielding 12%. Pretty soon though, the dividend was cut, and the yield decreased to 10% again. I was worried a little bit, but I decided that with a 10% yield I would be able to recover my losses over time even if the dividend was cut by a little bit again. For a while it did seem to me that I was going to break-even as I kept reinvesting my dividends and the price was slowly but surely climbing to the level at which I made my first investment. Then disaster strikes again - the dividend was cut and the stock fell again. I was starting to get worried, because I was getting a good yield, but my capital gains were pretty dismal. I checked the historical monthly dividend payments at yahoo finance and it seemed that the company actually had a long-term negative dividend growth. The monthly payments had been steadily decreasing ever since the fund was open for investors. In addition to that the price had been in a decline for some time. I finally realized that super high-dividend yields of over 6% annually are not sustainable in most situations. I also learned that if I would buy a stock just for the dividend payments, I should only buy companies/shares that have a solid history of raising their dividends in both bull and bear cycles over the years. In addition, the company should be a fundamentally sound business, which can afford to pay dividends even if business had a slow year. I also learned that I shouldn’t be chasing a stock simply because it offers an attractive very high yield.


The Managed High Yield Plus Fund has been trading in a range over the past 10 years assuming that you had reinvested your dividends. A $1000 investment made in late 1998, would have been worth 1280.83 by the end of 2007, which represents a 2.8% annual return. I could have achieved a much better return simply by buying CD’s, without taking on the risk of owning a volatile creature like HYF. By analyzing my trade it seems that I was chasing a stock that had increased tremendously off its 2002 lows, due to the fact that people were looking for anything that would produce any decent return on their investment, even though it had a negative dividend growth, which is a disaster waiting to happen to you. When the stock declined, I bought more. But since the dividend also declined I was buying a depreciating asset. Now I consider myself wiser – I buy stocks that show positive dividend growth. Even if the price declines I buy more, because I feel somewhat safer that the dividend is the last thing that the company would cut.

Monday, February 4, 2008

Why do I like the Dividend Aristocrats?

Some of my favorite stock lists is the S&P’s Dividend Aristocrats and the S&P High-Yield dividend aristocrats. These lists contain companies which have consistently increased their dividends over the past 25 years, which is a big achievement. These companies have gone through several up and down economic cycles and shown superiority of rewarding their shareholders with increasing payments through dividend growth.

The dividend aristocrats have averaged annual total returns of 12.93% per year since 1989, beating the S&P 500 total return of 11.66% by 1.3 annually. The dividend aristocrats outperformed S&P 500 in 9 out of the 18 years in this study. Investors in the dividend aristocrats suffered almost no losses during the 2000-2002 bear market; whereas the S&P 500 lost half of its value over the same period. While an 18 year period might not be representative of future performance, and future results might be very different, I still like the stocks in the list for their passive income generation potential which is a function of their ability to generate positive dividend growth. I believe that good dividend paying stocks are the only way out there to truly generate passive income streams without any significant amount of work in the future to sustain it. The only catch that involves a lot of work is selecting the stocks that would generate the future income. I think that this list gives you good solid value plays, which have sound fundamentals. Only a company with strong financials can afford to have positive dividend growth over time.

Academic research indicates that a simple buy and hold of an S&P 500 mutual fund outperforms almost any other strategy in the long run. I think though, that on average most baskets of US stocks, which show good diversification and hold at least 30 companies would produce annual returns which are very close to the S&P 500. With only 390 companies paying any dividends to their shareholders, still down from 402 in 1999, and sluggish long-term dividend growth in recent years, it seems to me that investors in the broad benchmark are still relying mainly on capital gains for their long-term performance. They seem to be forgetting that the market, although very rare, could fall for two or more years in a row, or trade in a range for 13 years, just like it did from 1966-1979. Any returns that were generated during that period were primarily due to reinvested stock dividends. Fundamentally speaking dividend paying stocks paying decent dividend yields could produce decent returns in bear markets, flat markets and even bull markets.


Relevant Articles:

- Best Dividends Stocks for the Long Run
- Best High Yield Dividend Stocks for 2009
- Dividend Aristocrats List for 2009
- Yield on Cost Matters
- The Dividend Edge

Dividend Increases in January

Several Dividend Aristocrats have increased their dividends in January. The companies are:
New Old Change
AFLAC Inc – Ticker AFL 0.96 0.82 17.07%
Comerica Inc – Ticker CMA 2.64 2.56 3.13%
Consolidated Edison – Ticker ED 2.34 2.32 0.86%
Family Dollar Stores– Ticker FDO 0.50 0.46 8.70%
McGraw-Hill Companies– Ticker MHP 0.88 0.82 7.32%

From this list, the only company that fits my fundamental criteria is MHP, which has a one year dividend growth rate of 7.32%. In terms of changes within the index I expect that SNV might be removed from the dividend aristocrats list. The reason is that its shareholders have received shares in TSYS, which was completely spun off from Synovus in the transaction at the beginning of 2008. On paper the dividend will be cut, but in reality this reflects a spin off and I guess the dividend aristocrats committee does not take into consideration the cash that stockholders received. I believe that SNV would keep increasing its dividends over time. The same thing happened with Altria group after the spin-off of KFT. Even though the dividend fell from 0.82 to 0.69, it’s crawling back up at the time of this writing and would soon exceed the pre-spin-off levels.

Expected dividend increases in February

Based off historical information from this spreadsheet, I would expect that the following companies increase their dividend in February: MMM ABT ADM CINF KO KMB NUE PBI SHW SIAL WWY. Those dividend aristocrats have increased their dividends during every month of February over the past 4 years. Upon a closer examination of the dividend growth behavior of the 60 dividend aristocrats, it seems that every month there is at least one company that raises its dividend. It’s nice to get a pay raise every month. The only company that has increased its dividend twice in one year is STT- State Street.

Relevant Articles:

- Dividend Aristocrats List for 2009
- Dividend Aristocrats
- Best Dividends Stocks for the Long Run
- Best High Yield Dividend Stocks for 2009
- Best CD Rates

Saturday, February 2, 2008

Outperform S&P500 with S&P500 futures, Part 2

It is a well known fact that over time the stock market is in a long-term secular bull market. We do get potential hiccups like the Asian financial crisis in 1997-1998, as well as some major bear markets like the one after the 1929 crash, the1973-74 bear market and the 2000-2002 burst of the internet bubble. Since the stock market always seems to recover from any declines over any period of time, I believe that a long-only approach for holding a basket of stocks like the S&P 500 would be a profitable strategy in the long run. In my previous article (Outperform S&P500 with S&P500 futures, Part 1) we learned that an investor can participate in the upside or downside movements of the index with only a controlling stake ( the margin requirement) of 10% of the value of S&P 500 e-mini futures contract. So what could the result be if we try to enhance our S&P 500 exposure through investing in stock index futures? It is possible to achieve the 1.25, 1.5 or even 2 times the annual percentage return of the S&P 500 index through buying more contracts covering a higher dollar amount of S&P 500 companies. This strategy would be profitable in the long run only if done with at least several million dollars in order to correctly enhance the annual portfolio return. So lets say that we start with $10,000,000 and for simplicity sake the S&P 500 is trading at 1,000 at year end which means that every e-mini futures contract is valued at $50,000. We would like to achieve a 1.25 times the return of the index. Thus, instead of buying 200 e-mini contracts, we would buy 250. We would have to roll-over each quarter the futures contracts that we have and try to maintain their number unchanged over the course of the year. Let’s say that at the end of the year the S&P 500 is trading at 1,100, which is a 10% annual return. Our contract is valued at 55,000 now. But since we have 250 contracts, our annual gain is 12.5%. If however the index fell by 10% we would lose 12.5%. We need to rebalance our portfolio every year however, in order to accurately try to achieve a 1.25 times the performance of the underlying. Assuming that we had a gain in year 1 of 10% the value of our enhanced portfolio would be $11,250,000. This could allow us to buy 204.55 contracts at the current value of $55,000. In order to achieve a 1.25 times the enhanced return in year 2, we need to own 255.68 contracts. Unfortunately though, one cannot buy fractions of futures contracts. We could however substitute the fractions with ETF’s covering the S&P 500 index. .68 contracts @ $55,000 equal $37,400. We could simply buy around 340 shares of SPY, which normally trades at around 10% of the value of the S&P 500 index.


This strategy works very well during bull markets, since it compounds your gains significantly. During bear markets though, an investor using the enhanced approach would suffer higher losses than those who invest using the non-enhanced approach. It would take investors much more time to recover from the enhanced losses and thus the strategy would have to deliver very high results in order to recover to the breakeven level. If you refer to figure 2, you will see that a 10% loss only requires an 11% gain to recover. However, once you lose over 50%, you need to achieve enormous gains JUST to break even.
Thus, I would not enhance my exposure to S&P 500 through futures by more than 1.25 times. If your exposure is 2 times, then you will be wiped out if the index falls by 50% in a given calendar year. In order for me to be wiped out with a 1.25 times exposure, the index would have to fall by 80% in a calendar year.

Friday, February 1, 2008

Outperform S&P500 with S&P500 futures, Part 1

The S&P 500 futures contract comes in two sizes – S&P500 (SP) or e-mini S&P500 (ES). The SP moves by $250 for every 1 point move in the underlying index, while the ES moves by just $50. Thus if the futures are trading at 1330, if you buy one SP contract you are basically buying 250*1330= $332,500 worth of stocks. When you buy one ES contract, you are basically controlling one fifth of the large contract or $66,500. Another major difference in both contracts is the fact that the large one is traded primarily on the floor of CME, while the e-minis are traded electronically, almost around the clock. The contracts always expire on the third Friday of each March, June, September and December.

The futures do not pay dividends, but they also trade at a premium to the S&P 500 index, which declines as the index reaches its expiration day. The beauty behind trading the e-minis is that to trade one contract, you need to put only 4,000-5000 dollars in collateral. Thus, for less than 10% of the underlying contract value on the ES, you can participate in any upside/downside movements of the index. Thus if you had $66,500, you could simply buy one contract, put around 10% for margin requirements and then have 60,000 dollars in cash sitting idle. You earn money on the margin requirement because you have put the funds in a money market fund. With the remaining $60,000 though, you could create a bond/ CD ladder in order to make money from interest yields. The drawback is that you must trade 4 times a year in order to be fully invested in the index, because the contract expires every quarter. Most brokers allow you to trade the e-minis for as little as $2.40 per contract, which is less than trading $66,500 worth of SPY for example. Another drawback is that the index is settled every day, which means that if the S&P500 futures decline by 10% from your initial purchase at 1330, you will have to deposit and extra 133*50=6650 dollars to your account, otherwise you will get a margin call.

On December 31, 2007 the E-mini futures closed at 1477.25, while the S&P 500 index closed at 1468.36. The dividends during 1Q 2008 are expected to be around 7 points. Thus investors would have to achieve around 16 points in interest income just to break even. In order to achieve 16 points from interest, you need to have interest income of around 1.08% per quarter, which is 
an APY of 4.37%. 


Any yield that the investor can achieve above 4.37 % APY would result in him/her outperforming the index. In today’s environment of rapidly declining interest rates though, it might not be possible to outperform the market using S&P 500 futures.

Using the interest rates from this website https://www.bankmw.com/Rates.aspx i was able to construct the following ladder ( on your left).

Assuming that interest rates decline, one would be able to outperform the S&P 500 slightly, assuming that the index does not fall more than 30% from its recent levels over the next 3 months and that interest rates decline below 4%. An analysis of the percentage draw downs in S&P 500 from its relative all-time highs could be very beneficial when constructing the ladder.


Tomorrow I would post my ideas on outperforming the market using an enhanced strategy.