Texas Instruments Incorporated (TXN) designs, manufactures, and sells semiconductors to electronics designers and manufacturers worldwide. It operates in two segments, Analog and Embedded Processing.
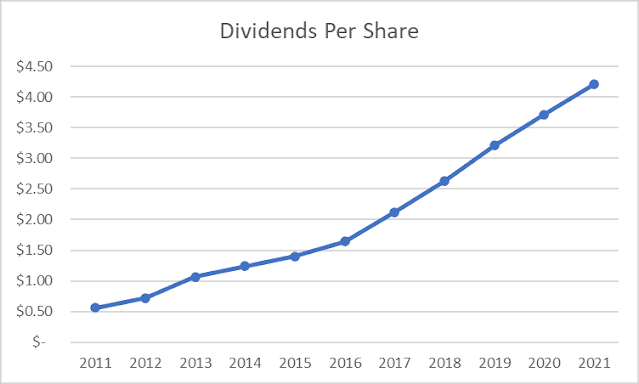
The company is a dividend achiever with 18 consecutive years of dividend increases. The last dividend increase was in September 2021, when the Board of Directors hiked quarterly dividends by 12.70% to $1.15/share.
Texas Instruments has managed to grow dividends at an annualized pace of 22.40% over the past decade.
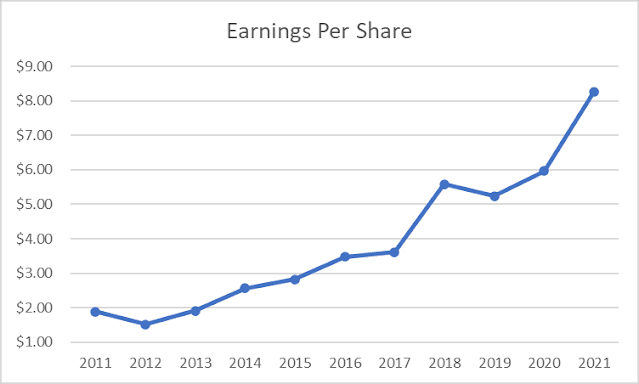
Texas Instruments managed to grow earnings from $1.88/share in 2011 to $8.26/share in 2021. The company is expected to earn $9.26/share in 2022.
While I focus on earnings per share, the growth in Free Cash Flow per share has mirrored EPS growth. TXN focuses on growing FCF/share. Their objective and the best metric to measure progress and generate long-term value for our owners is the growth of free cash flow per share.
I am going to repost their strategy to maximize and grow FCF/share. I love that they have a whole section on their Investor Relations Website, dedicated to growth in FCF/share: (Source: https://investor.ti.com/resources/capital-management)
Our strategy to maximize free cash flow per share growth has three elements:
• First, we have a great business model focused on analog and embedded processing products and built around four sustainable competitive advantages. In combination, our four competitive advantages provide tangible benefits, are difficult to replicate and ultimately separate us from our best peers. They are:
o A strong foundation of manufacturing and technology
o A broad portfolio of analog and embedded processing products
o The reach of our market channels
o Diversity and longevity of our products, markets and customer positions
• The second element of our strategy to maximize free cash flow per share growth is disciplined allocation of capital. This spans how we select R&D projects, develop new capabilities like TI.com, invest in new manufacturing capacity or how we think about acquisitions and returning cash to our owners.
• The third element of our strategy is efficiency, which we think of as always striving to get more output per dollar of cost. This is about getting our investments (spending) in the most impactful areas to maximize the growth of long-term free cash flow per share; it’s not just about optimizing cost-cutting to get the last dollar of expense. As owners, you will see this focus on efficiency contribute to revenue growth, improved gross margins, disciplined R&D and SG&A expense, free cash flow margins and ultimately to free cash flow per share growth.
We will remain focused on the belief that long-term growth of free cash flow per share is the ultimate measure to generate value. To achieve this, we will invest to strengthen our competitive advantages, be disciplined in capital allocation and stay diligent in our pursuit of efficiencies.
Analog is the company’s largest segment, with 77% of total revenue. It had $14.05 billion in revenue. The company is a leader in this segment, which is estimated to be valued at $55 billion. Every electronic product requires analog technology because analog provides the power to run devices and is fundamental to how technology interfaces with human beings, the real world and other electronic devices. Therefore, every time a system is “digitized,” there is growing need and opportunity for analog chips. Source: https://investor.ti.com/static-files/285c885f-42b8-4fb2-a7e3-8284f9413f2f
Embedded Processing has a 2021 revenue of $3.05 billion, or about 17% of total revenue. The company is also a leader in this segment, which is estimated to be valued at $18 billion. Embedded processors are the digital “brains” of many types of electronic equipment. They’re designed to handle specific tasks and can be optimized for various combinations of performance, power and cost, depending on the application.
The Other segment includes DLP® products and calculators. These account for about 6% of total revenues.
They share characteristics that make them both very attractive businesses:
• They’re pervasive; analog is used in every electronic device, and embedded processors are used in most.
• The markets are large, and while we enjoy leading positions in both, we have ample room to grow.
• They’re highly fragmented and diversified markets, comprised of hundreds of thousands of products and customers.
• They’re produced on manufacturing equipment that lives for decades, making the business less capital-intensive.
• Many of the products often last for decades, increasing stability of revenue and returns on investment.
• They both have history over decades of strong cash generation
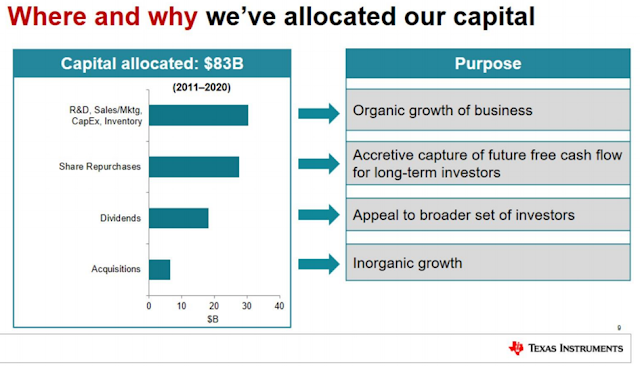
In the past decade, the company has outlined how it has spent capital. Spending on R&D, Sales/Marketing, CapEx and Inventory has helped in organic growth. The company spends more than 10% of every sales dollar on research and development, in order to come up with new offerings to customers in the industrial, automotive, personal electronics, communications equipment and enterprise systems. However, acquisitions have helped too, albeit their scale is not very high. The rest was returned to shareholders in the form of dividends and share buybacks.
I would encourage you to review the Capital Allocation Slides for 2021: https://investor.ti.com/static-files/f857ded4-a672-4de0-adf8-09763519bd1c
Texas Instruments targets to return all free cash flow to shareholders in the form of dividends and share buybacks. The company targets a dividend that is between 40% - 60% of Free Cash Flows. It sets share buyback amounts as the difference between what the business needs to grow and sustain competitive advantages, minus the amounts paid out for dividends.
Growth in earnings per share was aided by a consistent share buybacks. Between 2011 and 2021, the number of shares outstanding went down by a little over 20%. The number of shares decreased from 1.171 billion in 2011 to 936 million in 2020.
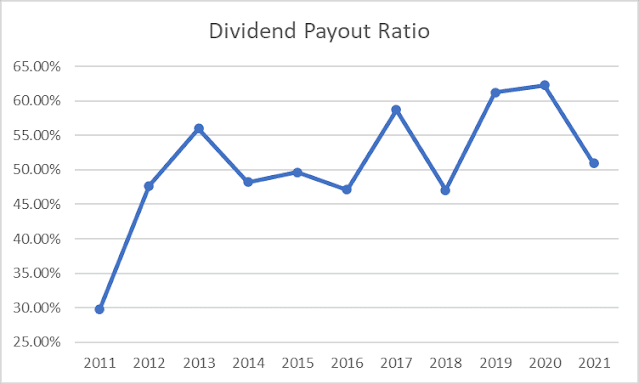
The dividend payout ratio has increased from 30% in 2011 to 51% in 2021. Much of the growth occurred through 2012/2013. Since then, the payout ratio has remained in a high range of 45% - 65%. Future dividend growth would be limited to growth in earnings per share.
The stock sells for 19.08 times forward earnings and yields 2.66%.
Relevant Articles:


