Dividend Growth Investor Newsletter

Pages

Thursday, November 30, 2023

Sources of Investor Returns: Visa Edition

 Investor returns are a function of:

1. Dividends

2. FCF/Share Growth

3. Change in valuations

The first two items drive the fundamental return for investors. The last item is the speculative return.

It is important to understand where investor returns come from.

Let's illustrate this concept with an actual example, using Visa (V).

At the end of 2012, Visa $V stock sold at $37.90/share. The stock had a forward annual dividend of $0.33/share. 

The company generated $1.74/share in Free Cash Flow.

The stock had a low yield of 0.87%, and a Price to FCF of 21.78.


In 2022, Visa generated $8.58 in FCF/share. The trailing 12-month FCF is at $10.52/share. The stock has a forward annual dividend of $2.08/share.  

Visa yields 0.88% today. It sells for 22.50 times trailing FCF..

An investor who bought 1 share of Visa at the end of 2012, and reinvested dividends, would have 1.077665 shares today.

This $37.90 investment in Visa turned to $252.87


Going back to the formula for estimating returns, they are a function of:

1. Dividends

2. FCF/Share Growth

3. Change in Valuation Multiple


For Visa, between 2012 and today, the majority of returns in this case came from growth in FCF/Share from $1.74 to $10.52.

This drove growth in dividends, though dividends accounted for a smaller return than growth in FCF/Share.

The slight uptick in valuation contributed a miniscule amount to returns.


Going forward however, any thing could happen. There are various outcomes/possibilities.

For example, the business may still grow at a high pace over the next decade (though probably not by 500%).

However, a contraction in the valuation multiple could depress returns over a short period of time such as a decade

For example, if Visa generated $25/share in FCF in 2034, that would be a 137% increase in FCF/Share

However, if the business sells for only 10 times FCF, the share price would be $250. So that would be not much further from here, because the speculative return would be negative.

In that case, dividends would likely provide a higher level of returns, as yields would be higher and there would be less of a need for growth to generate returns.

The total investment return would be higher than the share price, because of the DRIP.

If the business sells for 20 times FCF, share prices would likely be driven by FCF/growth and Dividend reinvestment for the rest. The speculative return would be negative, but won't have much of a noticeable impact.


It is fascinating to look at the past history of FCF/EPS, Dividends, Valuations, and try to project onto the future, while also thinking of various scenarios. Note, I am not predicting anything, just trying to show how change in one variable could have a drastic impact. 

For example, a business could operate at a steady rate of growth, but could generate great returns if the valuation multiple stays flat, but terrible returns if the valuation multiple shrinks. That's assuming we did a good job evaluating the fundamental characteristics of the business of course. 

So even if we did a good job of evaluating a business, we have no idea what the multiple would be in a decade for example. It's just good to be aware that various outcomes are possible. This keeps us humble, and searching for ways to protect ourselves from future ignorance. 

To me, this means diversification, and trying to avoid overpaying for a security. Sometimes, a security would get ahead of itself, and sell at a very high valuation. This depresses future returns, even if the business does as expected. On the other hand, the business may do well, while the security languishes for a long time. This increases future returns. It's therefore important to have some margin of safety. Easier said than done of course.

 It also means building out positions slowly and overtime, while checking my thesis. It also means limiting how much I invest in a security. Reinvesting dividends elsewhere, versus DRIP is another risk management tool, as is keeping investment costs low.

Having an exit plan set out before the investment is purchased can be helpful as well

Monday, November 27, 2023

Hormel Foods Dividend Stock Review

Hormel Foods Corporation (HRL) develops, processes, and distributes various meat, nuts, and food products to retail, foodservice, deli, and commercial customers in the United States and internationally. The company operates through four segments: Grocery Products, Refrigerated Foods, Jennie-O Turkey Store, and International & Other. 

The company increased dividends by 2.70% to $0.2825/share. This marked the 58th consecutive annual dividend increase for this dividend king. Having the ability to grow dividends for 58 years in a row is not a small accomplishment. In fact there are less than 40 companies in the US which have accomplished that.

Unfortunately, this is the slowest pace of annual dividend increases for Hormel since 2009. I took a look at the annual dividend increases for Hormel, going back to 1990 to observe that. I find it helpful to review trends in dividend increases over time.


You can also see that the pace of annual dividend increases for Hormel has been decreasing over the past four years. This is why the 5 year annualized rate of dividend growth is 8.90%, while the ten year annualized rate of dividend growth is 13.20%.

I still like viewing the growth in annual dividends per share. However, we need to do some more digging beyond that (per usual).


First, we need to take a look at the trends in earnings per share over the past decade.  You can see that Hormel was able to grow earnings per share from $1/share in 2013 to a high of$1.91/share in 2018. For the next 4 - 5 years however, the company has been unable to increase earnings per share above $1.91/share. I am also including forward earnings estimates of $1.63/share for 2023.

If you take a step back, you may notice that the company has basically been unable to grow earnings per share in any meaningful way since it earned $1.68/share in 2016. Without growth in earnings per share, there is a natural limit to growth in dividends per share and growth in the intrinsic value of the company.


You can also observe the relationship between earnings per share, valuation and share prices over the past decade. The stock is basically where it was five years ago or so, mostly because earnings per share have been flat, and the valuation multiple shrank to a more reasonable level at around 20.

The share price was at $21.73 at the start of the study period, which translated to a P/E ratio of almost 22. By 2018, when we achieved record earnings for the decade, the share price was at $43.64, which translated to a P/E ratio of 23. 

At extreme highs in 2016 and 2022, the stock sold as high as 34 times earnings and 33 times earnings. That translates to as high as 27 - 30 times forward earnings.

Even at the lows in 2017, the stock didn't sell materially below 20 times earnings. In my opinion, without growth in earnings per share, future dividends and growth in intrinsic value would be limited. You would likely see the stock in a range, with majority of gains driven by valuation multiple changes and whatever dividends that are paid to shareholders. My goal is to find companies that can grow earnings, dividends and intrinsic values over time, and buy them at a decent entry valuation. Timing valuation changes only is not a game I try to play.

If the company managed to grow earnings per share from here however, it may do well for shareholders who consider it today. 


Second, we need to take a look at trends in the dividend payout ratio. You can see that the dividend payout ratio was largely in a range below 40% - 45% before 2017 - 2018. You van see that the dividend payout ratio has been increasing to over 55% by 2022. At the same time earnings per share were basically flat over the last 4 - 5 years.

As a result, the growth in dividends per share since at least the past 4 - 5 years has been a direct result of the company paying a larger share of earnings as dividends. Unfortunately, there is a natural limit to the dividend payout ratio, so the closer you get to 100%, the lower the company's ability to grow dividends over time. The increase in the payout ratio basically explains why dividend growth has been decreasing. If the company is unable to grow earnings per share over time, it may even be unable to increase dividends at all, thus losing its status of a dividend king in a few years.

The forward dividend payout ratio is close to 69% right now, which seems high.


However, if the lack of increase in earnings per share is only temporary, and it resumes in the future, then the company would be able to grow dividends over time and reduce the payout ratio. We have to wait and see.

Next, I also took a look at the trends in shares outstanding for Hormel. You can see a slight increase in shares outstanding over the past decade to about 545 million shares.


Overall, the stock sells for 20 times forward earnings today and yields 3.45%. The dividend has a decent coverage rate today out of earnings. Unfortunately, the lack of earnings growth over the past five years or so gives me pause before considering buying today. If the company can manage to grow earnings per share out of this 5 year slump, then it would likely do well for shareholders.


Monday, November 20, 2023

Nine Cash Machines Hiking Dividends Last Week

 I review the list of dividend increases every week, as part of my review process. I focus my attention on companies that raised dividends in the current week, and have at least a ten-year track record of annual dividend increases.

Only a company with a strong cash flow generating business can afford to grow dividends for a long period of time. Therefore, a business growing dividends for at least a decade is worth looking at for further research.

There were nine companies that fit the criteria. You can view the five companies in the table below:


This is a list of companies for further review. Most seem attractive as businesses, but that doesn’t mean that they should be invested in at any price, regardless of valuation.

In reviewing the press releases for several of these companies, I liked the following snippets. These snippets showcase the commitment to dividend growth and the importance of it. 


Brown-Forman (BF.B): “We are proud to continue the long tradition of delivering excellent returns to our shareholders. This marks the 40th consecutive year of dividend increases and reinforces our confidence in Brown-Forman's long-term growth outlook.”

Nike (NKE): “Nike has a consistent track record of delivering strong cash flow and returns for shareholders and today’s announcement marks the 22nd consecutive year we have increased our dividend,” said John Donahoe, President & CEO, NIKE, Inc. “This dividend increase reflects our continued confidence in our strategies to generate sustainable, profitable growth, while investing for the future.”

Matthews International (MATW): "We continue to maintain a strong cash flow profile facilitating ongoing support of our long-term growth objectives.   This represents our 30th consecutive annual dividend increase since becoming a publicly-traded company.”

Royal Gold (RGLD): “Paying a growing and sustainable dividend continues to be a core strategic objective for Royal Gold,” commented Bill Heissenbuttel, President and CEO of Royal Gold. “We have paid a dividend since 2000, and despite volatility in the gold price we’ve increased our annual dividend every year since 2001. Our focus on consistently increasing our capital return to shareholders is unique in the precious metals sector, and Royal Gold is the only precious metals company in the S&P High Yield Dividend Aristocrats Index.”


This would likely be the last post for me this week. I will look forward to the Thanksgiving raises from Hormel Foods, McCormick, York Water Company, South Jersey Industries and Hingham Institution for Savings.

Relevant Articles:

- 14 Dividend Growth Stocks Rewarding Owners With A Raise


Thursday, November 16, 2023

Microsoft During the lost decade

Microsoft (MSFT) generated $1.15/share in Free Cash Flows in 1999 and managed to grow that to $3.45/share in 2012. That's a 200% growth in Free Cash Flow per Share over that time period.

Yet, Microsoft $MSFT stock sold at $58.38/share at the end of 1999. But by the end of 2012, the stock declined by 54% to $26.71/share.

To appease shareholders who hadn't seen any capital appreciation for years, Microsoft started paying dividends in 2003.

A $100 investment in Microsoft at the end of 1999 was worth $51 by the end of 2012, when you account for dividend reinvestment.


Why did Microsoft deliver such terrible performance?


It's because the stock was overvalued in 1999, selling for almost 51 times FCF/Share.

The stock was undervalued in 2012, selling for 8 times FCF. 


Investors were excited about the company's growth prospects in 1999, and willing to pay a massive premium for those cashflows. This is why the valuation multiple was high. This is why returns from 2000 - 2012 were not good. Despite growth in the underlying business, the stock delivered poor performance, due to shrinking in the valuation multiple.


Investors in 2012 saw the company as a value trap, and were willing to give it away at a steep discount. This is why the valuation multiple was low. This is why it delivered great returns from 2012 - 2023.


What is the point of this story?


It is to educate investors about the sources of total returns.

In general, total returns are a function of:


1. Dividends

2. Earnings Per Share/Free Cash Flow Per Share Growth

3. Changes in valuation multiples


The first two items are both portions of the fundamental returns. They are directly related to the performance of the business.

The last item is the speculative return. It is dependent on the "mood" of Mr Market, or the market participants

This story also shows you that the pendulum can swing from a period of excitement, to doom and gloom. 

Even a business that does well over time would have long periods of time where the stock price goes nowhere. Being a long-term investor is not easy, because to earn the great returns of investing, you need  to be sitting through the long periods of poor performance, in order to experience the joys of good performance. There is no way around that.

Monday, November 13, 2023

14 Dividend Growth Stocks Rewarding Owners With A Raise

I review the list of dividend increases every week, as part of my portfolio monitoring process. I leverage several of my dividend investing resources for this effort.

I started by reviewing the list of all dividend increases for the week. There were 32 of them. I then narrowed the list down to the companies that have managed to boost dividends for at least ten years in a row. I also focused on companies that had a meaningful combination of yield and dividend growth.

The companies for this week’s review include:


The next step in the process would be to review trends in earnings per share, in order to determine if the dividend growth is on strong ground. Rising earnings per share provide the fuel behind future dividend increases.

This should be followed by reviewing the trends in dividend payout ratios, in order to check the health of dividend payments. A rising payout ratio over time shows that future dividend growth may be in jeopardy. There is a natural limit to dividends increasing if earnings are stagnant or if dividends grow faster than earnings.

Obtaining an understanding behind the company’s business is helpful, in order to determine how defensible the dividend will be during the next recession. Certain companies are more immune to any downside, while others follow very closely the rise and fall in the economic cycle.

Of course, valuation is important, but it is more art than science. P/E ratios are not created equal. A stock with a P/E of 10 may turn out to be more expensive than a stock with a P/E of 30, if the latter is growing earnings and the former isn’t. Plus, the low P/E stock may be in a cyclical industry whose earnings will decline during the next recession, increasing the odds of a dividend cut. The high P/E company may be in an industry where earnings are somewhat recession resistant, which means that the likelihood of dividend cuts during the next recession is lower.

For a sample dividend stock analysis, check my review of Atmos Energy (ATO).

Relevant Articles:

- Five Dividend Growth Companies Raising Dividends Last Week


Thursday, November 9, 2023

Dividends are a return on investment and a return of investment

Back in September 2023, Microsoft increased quarterly dividends by 10% to $0.75/share. This was the 19th year of consecutive annual dividend increases for this dividend achiever. 

This prompted me to think about the investment history of Microsoft as an investment from a lense of a dividend growth investor. 

If you bought Microsoft $MSFT at the end of 2012 you paid $26.71/share

You'd have received $19.08/share in dividends

Investors who owned  Microsoft for over 10 years have received over 70% of their original investment back in the form of dividends

Dividends represent a return on investment and a return of investment


Microsoft grew FCF/Share from $2.93 in 2013 to $7.99 in 2022

The valuation multiple increased from 9 times FCF in 2012 to over 40 times FCF in 2023

The 2012 investor is earning an yield on cost of 11.23%


It's also helpful to look at another company, Altria (MO).

If you bought Altria $MO at the end of 2012 you paid $31.44/share.

You'd have received $31.08/share in dividends.


Investors who owned Altria for over 10 years have received more in dividends than what they paid for the stock


Dividends represent a return on investment and a return of investment.

 I explained in a previous post that Altria delivered the same level of FCF/share growth as Microsoft over the past decade. However, it delivered a worse total returns. That's because the valuation multiple shrunk for Altria, but increased for Microsoft.

Monday, November 6, 2023

8 Dividend Growth Stocks Rewarding Owners With A Raise

I review the list of dividend increases every week, as part of my portfolio monitoring process. I leverage several of my dividend investing resources for this effort.

I started by reviewing the list of all dividend increases for the week. There were 45 of them. I then narrowed the list down to the companies that have managed to boost dividends for at least ten years in a row. I also focused on companies that had a meaningful combination of yield and dividend growth.

This list is not a recommendation to buy or sell stocks. It is simply a list of companies that raised dividends last week. The companies listed have managed to grow dividends for at least ten years in a row.

The companies for this week’s review include:


CDW Corporation (CDW) provides information technology (IT) solutions in the United States, the United Kingdom, and Canada. It operates through three segments: Corporate, Small Business, and Public. 

The company increased quarterly dividends by 5.10% to $0.62/share. This was the 10th consecutive year of annual dividend increases for this newly minted dividend achiever. Over the past 5 years, the company has managed to raise dividends at an annualized rate of 24.80%.

Between 2013 and 2022, the company managed to grow earnings from $0.85/share to $8.24/share.

The company is expected to earn $9.87/share in 2023.

The stock sells for 21.20 times forward earnings and yields 1.18%.


Huntington Ingalls Industries, Inc. (HII) engages in designing, building, overhauling, and repairing military ships in the United States. It operates through three segments: Ingalls, Newport News, and Mission Technologies. 

The company increased quarterly dividends by 4.80% to $1.30/share. This was the 11th consecutive year of annual dividend increases for this dividend achiever. Over the past 5 years, the company has managed to raise dividends at an annualized rate of 13.70%.

Between 2013 and 2022, the company managed to grow earnings from $5.25/share to $14.44/share.

The company is expected to earn $14.49/share in 2023.

The stock sells for 16.15 times forward earnings and yields 2.22%.


KLA Corporation (KLAC) designs, manufactures, and markets process control, process-enabling, and yield management solutions for the semiconductor and related electronics industries worldwide. It operates through three segments: Semiconductor Process Control; Specialty Semiconductor Process; and PCB, Display and Component Inspection.

The company increased quarterly dividends by 11.50% to $1.45/share. This was the 13th consecutive year of annual dividend increases for this dividend achiever. Over the past 5 years, the company has managed to raise dividends at an annualized rate of 15.80%.

Between 2013 and 2022, the company managed to grow earnings from $3.51/share to $24.28/share.

The company is expected to earn $23.67/share in 2023.

The stock sells for 21.10 times forward earnings and yields 1.16%.


Microchip Technology Incorporated (MCHP) develops, manufactures, and sells smart, connected, and secure embedded control solutions in the Americas, Europe, and Asia. 

The company increased quarterly dividends by 7.10% to $0.439/share. This is also a year-over-year increase in the dividend of 33.80%, up from the November 2022 dividend of $0.328/share. This was the 21st consecutive year of annual dividend increases for this dividend achiever. Over the past 5 years, the company has managed to raise dividends at an annualized rate of 9.90%.

This represents 85 consecutive quarters of dividend payments for Microchip and reflects confidence in the cash-generating capability of our business, as well as our ongoing commitment to returning capital to our stockholders.

Between 2013 and 2022, the company managed to grow earnings from $1/share to $4.07/share.

The company is expected to earn $5.38/share in 2023.

The stock sells for 14.20 times forward earnings and yields 2.30%.


Regency Centers  (REG) is a preeminent national owner, operator, and developer of shopping centers located in suburban trade areas with compelling demographics.

The REIT increased quarterly dividends by 3.10% to $0.67/share. This was the 10th consecutive year of annual dividend increases for this newly minted dividend achiever. Over the past 5 years, the company has managed to raise dividends at an annualized rate of 3.50%.

The REIT is selling for 15.13 times forward FFO and yields 4.27%.


Snap-on Incorporated (SNA) manufactures and markets tools, equipment, diagnostics, and repair information and systems solutions for professional users worldwide. It operates through Commercial & Industrial Group, Snap-on Tools Group, Repair Systems & Information Group, and Financial Services segments.

The company increased quarterly dividends by 14.80% to $1.86/share. This was the 14th consecutive annual dividend increase for this dividend achiever. Over the past 5 years, the company has managed to raise dividends at an annualized rate of 14.80%.


“This 14th consecutive annual increase in our dividend confirms our commitment to create long-term value for our shareholders and demonstrates our firm belief that Snap-on is well-positioned for the future. Our strong financial position and robust cash generation enable us to reward our shareholders with a consistently increasing cash dividend and to support our ongoing strategic investments, organically and through acquisitions, along our defined runways for both growth and improvement.”


Between 2013 and 2022, the company managed to grow earnings from $6.02/share to $17.14/share.

The company is expected to earn $18.66/share in 2023.

The stock sells for 14.50 times forward earnings and yields 2.75%.


Tennant Company (TNC) designs, manufactures, and markets floor cleaning equipment in the Americas, Europe, the Middle East, Africa, and the Asia Pacific. 

The company increased quarterly dividends by 5.70% to $0.28/share. Tennant Company has paid a cash dividend for the past 79 consecutive years and increased the dividend payout for 52 consecutive years.  Over the past 5 years, this dividend king has managed to raise dividends at an annualized rate of 3.90%.

“Our strong balance sheet, liquidity position and disciplined capital allocation program allow us to continue to grow our dividend and generate long-term value for our shareholders,” said Tennant Company President and CEO Dave Huml.


Between 2013 and 2022, the company managed to grow earnings from $2.20/share to $3.58/share.

The company is expected to earn $5.90/share in 2023.

The stock sells for 13.95 times forward earnings and yields 1.36%.


Utah Medical Products, Inc. (UTMD) develops, manufactures, and distributes medical devices for the healthcare industry. 

The company increased quarterly dividends by 1.70% to $0.30/share.  This was the 19th consecutive annual dividend increase for this dividend achiever. Over the past 5 years, the company has managed to raise dividends at an annualized rate of 1.80%.

Between 2013 and 2022, the company managed to grow earnings from $3.06/share to $4.53/share.

The company is expected to earn $4.65/share in 2023.

The stock sells for 17.20 times forward earnings and yields 1.50%.


Relevant Articles:

- Twenty Dividend Growth Stocks Raising Dividends Last Week

- Seven Dividend Growth Stocks Raising Dividends Last Week

- Five Dividend Growth Companies Raising Dividends Last Week


Friday, November 3, 2023

Microsoft and Altria: A Look at the past decade

Microsoft (MSFT) and Altria (MO) grew Free Cash Flow/share at roughly the same rate between 2012 and 2022

Each company has delivered different total returns since the end of 2012 however.

Microsoft delivered a total return of 1423%.

Altria delivered a total return of 156%.


Microsoft grew FCF/Share from $2.93 in 2013 to $7.99 in 2022, which is a 173% increase.

The valuation multiple increased from 9 times FCF in 2012 to over 40 times FCF in 2023.


Altria grew FCF/Share from $1.86 in 2012 to $5.02 in 2022, which is a 170% increase.

The valuation multiple shrunk from 17 times FCF to 8 times FCF.


The remainder of total returns for each is explained by dividend reinvestment.


One share in Altria from end of 2012 turned to 1.89 shares through DRIPs today

One share in Microsoft from end of 2012 turned to 1.22 shares through DRIPs today


Ultimately, Microsoft delivered a higher total return because its valuation multiple expanded, while Altria's valuation multiple shrank


It's important to think about the sources of total returns. In general, total returns are a function of:

1. Dividends

2. EPS Growth/FCF Growth

3. Changes in valuation


The first two items are the so called fundamental returns. They are very important in the long-run, but not as much in the short run.

The last item is the speculative return. Its impacts are very pronounced in the short-term, but negligible over  the really long-run

It is important to understand where returns comes from.


It's fascinating that back in 2012 Microsoft sold at less than 10 times earnings and yielded about 3%

Everyone viewed it as a value trap

Yet an investor who bought at the end of 2012 is earning an yield on cost of 11.23%

Today, Altria is viewed as a value trap. Whether that turns out to be true or false, let's circle back in a decade to find out.


I hope you enjoyed this!

Thursday, November 2, 2023

A look at Realty Income's Historical Drawdowns

Realty Income $O stock has declined by 42% off the all-time-highs set in February 2020 of $82.23/share

It's still above the pandemic lows of $36.80/share from March 2020. The share price is 36% below the highs of $75/share set in 2022.

I decided to take a look at previous large drawdowns, for perspective. Largely, each crisis and drawdown were different. Yet, despite all that, Realty Income managed to overcome that crisis, and keep growing FFO/share and dividends/share. Past performance is not an indication for future results. But as an equity analyst, that's all the information I can base my decisions on. My guess about the future is as good as yours. But it does seem plausible that a company that overcame a lot of calamities in the past would likely be prepared to overcome future calamities as well. Let's circle back in 5 years to tell me if I was totally wrong or on the right path...


Covid

The first drawdown was around the time Covid hit.


The stock went down from a high of $82.23 in Feb 2020 to a low of $36.80 in Mar 2020. The valuation went from 25 times FFO and a dividend yield of 3.28% in February 2020 to 11.20 times FFO and a 7.34% dividend yield in March 2020.

That was a 55% decline. The lockdowns were hard on the retail sector, as many locations were ordered shut down by the government. Despite all of that, Realty Income managed to collect most of the rent, and kept raising dividends and growing FFO/share.

Interest rates did decline during that time period, though we also had a great depression type situation that compressed a depression into a couple of months. The speed of the drop was scary.


FED Raising Rates since 2022

While the stock did not exceed the 2020 highs, it reached a high of $75 in 2022.  We are now a little over an year into this drawdown. Yet, FFO/share is growing along the way...

The valuation went from 25 times FFO and a dividend yield of 3.96% in August 2022 to 11.15 times FFO and a 6.83% dividend yield in October 2023.


Global Financial Crisis


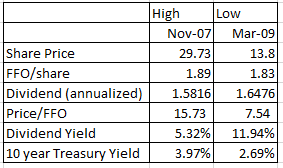
Around the time of the Global Financial Crisis, the stock topped at $29.73/share in November 2007.  It then proceeded to decline all the way down to $13.80/share by March 2009. That's an almost 54% decline in about an year and a half.  Note the stock reached an all time high of $33.76 briefly in September 2008, but that was mostly as short selling on financials was banned in the US, which spurred short covering.

The valuation went from 15.70 times FFO and a dividend yield of 5.32% in November 2007 to 7.54 times FFO and a 11.94% dividend yield in March 2009.


That was a dark time, because of the Great Recession. Many people lost their jobs, companies closed doors, and the economy was in a recession. The Retail sector was in trouble, along with real estate as well. The Housing Bubble affected everything. Despite all of that, Realty Income managed to maintain FFO/share and even grow dividends to maintain its streak. 

The Global Financial Crisis had issues that were core to the economy. We had softness that was overcome by declining rates. The credit markets were frozen at one point however, which made accessing capital harder.


Late 1990s, Dot-Com Bubble and Rising Rates

The next decline occurred at the end of the 1990s. The stock reached a high of $13.47/share in August 1997. It then proceeded to decline for 3 years, until it reached a low of $9.32/share in March 2000. This decline was driven by a few different factors, but it does remind me somewhat of the current decline. 

The valuation went from 12.15 times FFO and a dividend yield of 6.80% in August 1997 to 7.58 times FFO and a 11.23% dividend yield in March 2000.


That's because demand for hot growth equities and the new economy caused investors to abandon any traditional metrics of value, and pursue the future at any price. In addition, interest rates were increased at a fast pace starting in 1999, reaching their highs in 2000.

REITs were so unloved in 1999 - 2000, that they even sold for less than liquidation values. They frequently offered yields that were close to 10%. At the lows in 2000, Realty Income yielded close to 11%. 

10 year treasuries yielded about 6.50% - 7% at the time.

Despite the valuation compression, the REIT kept growing FFO/share, and raising dividends. Investors who were paid to hold through the ups and downs persevered and were ultimately rewarded.

The early 2000s were actually a very good time to be a REIT investor (prior to 2008). Valuation multiples that were compressed prior to that, finally increased to more reasonable levels. Investors understood the value and were willing to pay more. The growth at any price crowd lost a ton of money.


Conclusion:

I hope you enjoyed this historical review of Realty Income's past declines. It really helps put the current drawdown in perspective. As a long-term Dividend Growth Investor, I buy a company at a good valuation, and hold on to it through thick or thin, for as long as the dividend is not cut. I plan to keep on holding on to my Realty Income stock for as long as the dividend is not cut. It is easier to hold psychologically, when I am paid to hold. And it's even easier when the amounts I am paid to hold tend to increase as well.